10 Best jQuery Graph-Chart Libraries With Demo & Comparison Table
Sat Nov 04 2017
Paul Shan
If you are willing to add some graphical analysis in your website, photoshopped images aren’t a good way to showcase them as it will lack perfection & proper presentation. In such case, using a jQuery graph-chart library will be the best solution. A perfectly selected jQuery graph or chart library can reflect the analysis at its best with proper information & presentation.
In this article VoidCanvas is providing you the list of top 10 jQuery graph libraries that will help you demonstrate the graphical analysis in your website perfectly.
Why Graphs Are Important ?
Major reasons why you should focus on adding graphs properly:
- Graphs are very helpful to demonstrate data analysis & easy to understand.
- Needs less time to understand large data details.
- Quick process of getting main information.
- It’s easier to program then to photoshop.
We are providing a simple cheat sheet here so that you can easily compare between them, but i will recommend you to read about all the 10 jQuery graph plugins mentioned here for better understanding of their abilities.
| Name | Size (Kb) | Primary Features | Specialty | Documentation | Git Stars |
|---|---|---|---|---|---|
| morris.js | 38 | √ | Lots of contributors providing more stability | Mid | 6,600+ |
| Flot | 120 | √ | Real time Update(AJAX) | Good | 5,400+ |
| Cytoscape.js | 313 | Only Pie | Graph,Set Theory | Good | 3,600+ |
| OrgChart | 7.5 | X | Organization | Mid | 850+ |
| CanvasJS | 444 | √ | Chart with Animation | Good | - |
| jqPlot | 154 | √ | AJAX, Animation | Good | - |
| jQuery.flowchart | 20 | X | User editable Flowchart | Good | 180+ |
| Calx | 113 | √ | Calculation Form | Good | 150+ |
| FusionCharts | 22.5 | √ | 1000+maps & 90+ graphs | Good | 60 |
| FancyGrid | 128 | X | Grid | Good | - |
Primary Features signifies the basic data demonstrating graph-chart types such as bar graph, pie graph, line graph, area graph.
Top 10 jQuery Graph-Chart Libraries to Choose From
We are providing 10 best jQuery graph libraries here according to our research. All of them has their own features & uniqueness, choose the perfect one for your task.
morris.js
A good looking, easy to implement jQuery graph library helping you to demonstrate different data in a fine way. One of the simplest API widely used to draw line, bar, donut & area charts.

Features
- Easy to implement.
- Simplest API.
- Graphs consisting of lines, bars, donuts or areas can be prepared.
- Touch event handling available.
Flot
Widely used jQuery graph library. Graphs such as bars, lines, areas, points and or even any combinations of all these can be displayed on the same plot with even similar data. Flot is perfectly responsive, automatically redraw according to the window size.

Features
- Responsive.
- Real time update is possible using AJAX.
- Well customizable.
- Interaction with different data points.
- Time zone support.
- Can include static images against a set of axes.
Cytoscape.js
Cytoscape doesn’t generate the basic graphs you have known for years, it’s unique & useful graph reflecting technique made it quite popular. Cytpscape is highly preferable for rich interactive graph-charts. It lets the user interact with the displayed graph, the plugin tackles the user events with the client very well.

Features
- Highly optimized, especially used for interactive graphs.
- Supported by all modern browsers.
- Designed focusing on user ease, can be used by both the frontfacing app usecases and developer usecases.
- Supports different operations of set theory & graph theory.
- Customizable, Animatable & totally extendable.
- The graph analysis can be done in Node.js too.
- Gestures like box selection, pinch-to-zoom, panning, etc. available.
- Very well documented.
OrgChart
OrgChart is one of the best organizing jQuery chart plugin in the market. Creating the structural tree is very easy, all you have to do is, supply the id of the HTML element & do a single-line call to the extension.
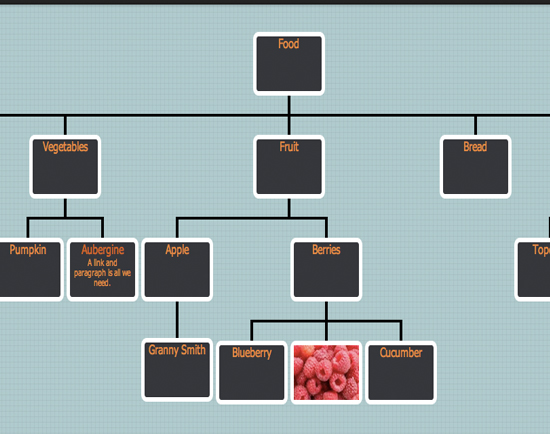
Features
- Easy to supply nested unordered list element.
- Supports JSON data and local data both.
- CSS3 transitions made the expand/collapse effects very smooth.
- Drag/drop nodes.
- User can edit the chart dynamically and the final hierarchy can be stored as a JSON object.
- Supports exporting chart as a picture or pdf document.
- Supports pan and zoom.
- Touch-enabled.
CanvasJS
CanvasjQuery let’s you create responsive & interactive graph charts using just couple of lines of codes. It is easily integratable with bootstrap & other popular JS frameworks. CanvasJS supports 30 different chart types like line charts, bar charts, financial charts etc.
Features
- Responsive & Interactive.
- Comes with 30 different types of charts.
- Dynamic updates, pan, zoom, image exporting etc. available.
- Easily customizable.
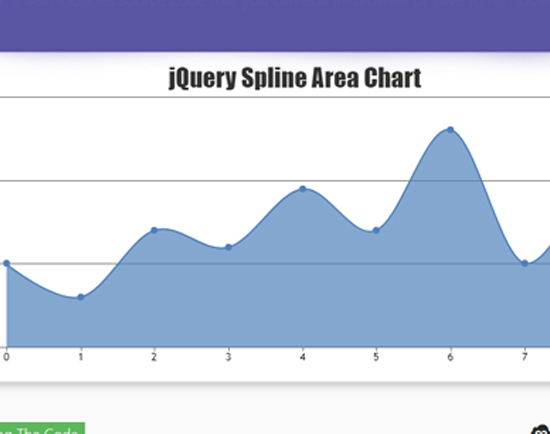
jqPlot
jqPlot helps generating client-side JS charts in the webpage. It’s a total package of different graph-chart reflection technique. Bar, Area, Bubble, Waterfall, Step, Pie, Pyramid charts and the list goes on.

Features
- Simple to use.
- AJAX JSON data rendering.
- Animated charts.
- Various chart themes available.
- Data display on mouse hovering.
- Lorenz Curves, Mekko Charts etc. different graph-chart displaying technique available.
jQuery.flowchart
As the name suggests jQuery.flowchart is an user friendly jQuery graph-chart plugin allowing you to create & edit flow charts easily.

Features
- jQuery UI plugin.
- Can display boxes and connection among them.
- End-user can edit the flow chart accordingly, such methods have been provided.
- Saving/loading of the flowchart can be done by the developer.
- PanZoom view, drag & drop features are also available.
- Great for ER diagrams.
Calx
Calx not only helps in generating line, bar or donut graph but also can create calculation form based of different formulas. The Calx is a jQuery plugin based on Excel calculation engine and formula parser.

Features
- Able create calculation form based of different formulas.
- Easy calculator builder.
- Able to generate bar, line or dount graph charts.
- Customizable.
- Can override the default function or can rewrite.
- Excel compatible formulas.
- Integrate seamlessly with your form.
FusionCharts
It was basically developed for vanilla JS, but due to the huge popularity of jQuery, developers launched another version satisfying the needs. FunsionCharts not only provides basic graph-charts (bar, pie, area charts etc.) but also some exceptional like thermometer, bucket etc. charts. The list is quite long.

Features
- Over 1000+ maps & 90+ charts available.
- Exceptional charts like thermometer, bucket etc available.
- Easily & efficiently integrate with other popular frameworks, libraries & languages.
- Can be easily molded according to your need.
- Single click export to PDF & images.
- Exceptional features such as adding custom shapes, custom tooltips, drill-down, trendlines, real-time charts, visually editable charts, multi-lingual charts, intelligent label management etc. are supported.
- Very well documented.
FancyGrid
The perfect grid library with charts integration and server communication. FancyGrid provides comprehensive collection of grid and form solutions for Enterprise.
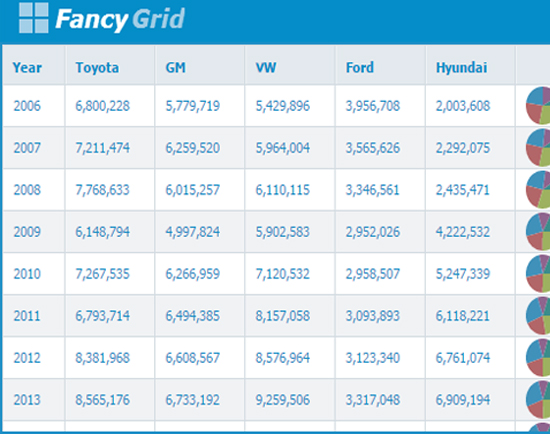
Features
- Add various themes.
- Paging, Sorting, Filtering, Validation can be done.
- adding AJAX data, file data is possible.
- Form modulation available.
- Touch screen compatible.
If you feel we are missing any popular jQuery graph-chart library in the list, let us know in the comment section.
SHARE THIS ARTICLE


Popular Articles
Authentication using Google's oAuth api with node.js
Thu Mar 10 2016
OAuth authentications are pretty popular now a days and another thing which is popular is JavaScript. This article shows how to plugin google’s oAuth api for authentication in your own node application.CSS3 Loader Snippet Collection: (Part 2 - Squares)
Sat Mar 01 2014
This is a continuation of my CSS3 loader snippet collection series. I've provided spinning css3 animation loader in the part 1 of this series and here in part 2, I'm providing various square type loading